
This post is a continuation of our series about paying down technical debt and re-architecting our platform. You can read the introductory post here: Paying Technical Debt to Focus on the Future.
Introduction
When Trulia began decomposing the PHP monolith that powers www.trulia.com into a service-oriented architecture, all supporting APIs and Services were placed in a family of AWS accounts owned by various functional units in the Engineering department. Many of these legacy AWS Services are deployed via AMI image promotion and use a variety of different approaches for observability. The manual effort required to add instrumentation to the codebases and to the infrastructure itself has been a traditional pain point at the brand. Further, this manual and individualized approach to building observability meant that there was no single codebase on which to collaborate on enhancements and tooling.
In 2017 we made the decision to build all new microservices on a unified container orchestration platform: Kubernetes. We wanted to standardize on one technology for metrics, monitoring, and traffic between microservices.
The existing service-oriented architecture had no unified approach to observability. Understanding what was going on in the ecosystem of microservices with respect to request rates, errors, and latencies was left to individual teams to manage. This caused each team to use a disparate set of tooling that included several vendors and other snowflake solutions. Access and authorization to all these tools were also managed by the individual microservice owners and exacerbated the challenge of having no single place to understand the ecosystem as a whole. Error diagnosis became an exercise in bouncing between many different AWS accounts, dashboards, and sets of tooling.
Additionally, there was no way the engineering organization at large could work together on improving the situation because the lifecycle of every EC2 instance, AutoScaling Group, and microservice codebase was individually managed. If you did manage to improve how HTTP response code 500 was aggregated in one Java-based microservice there was no way to propagate or share this change with another team trying to do the same. We began to look for other options.
We wanted to build a platform that separated the concerns of basic observability from the user building the microservice and allowed for an independent and shared pace of innovation for connectivity and observability between all microservices using this platform. Our technology selection to complement containers and Kubernetes was Istio.
The Approach
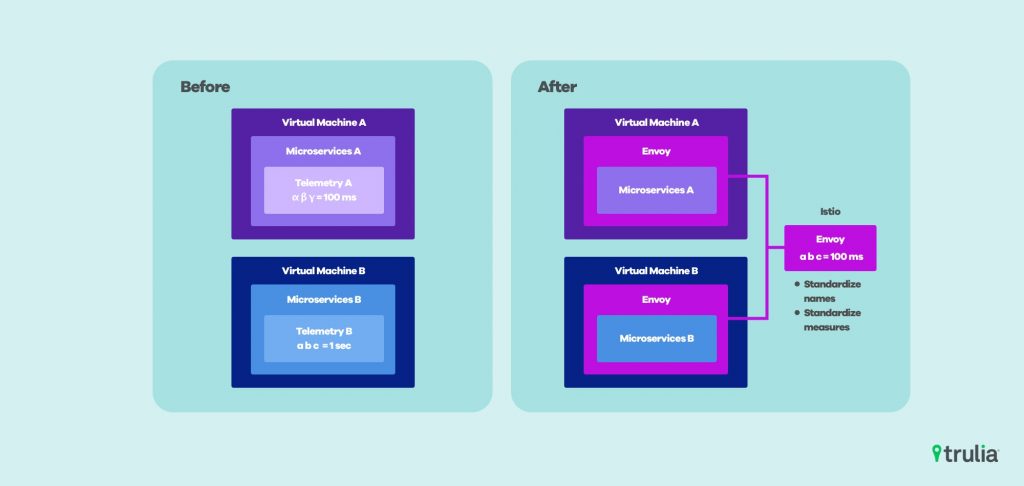
We use Istio to transparently proxy all communication out of our Kubernetes workloads. Moving all of the telemetry collection out of process, decoupling it from the individual microservice’s codebase.
Istio consists of three components: Pilot, Mixer, and Citadel. Pilot manages policy between Envoy instances, Mixer manages configuring every Envoy proxy, and Citadel manages mutual TLS and other security-related functions. We encountered some immediate challenges using the tool, including packaging and installation issues, auto pod injection functionality, and SNI / vendor support for Istio as a standalone Ingress.
To overcome some of these challenges as an early adopter we worked closely with the core Istio team at Google and Tetrate.io. The relationship helped us to avoid common pitfalls, provided their core team with direct feedback, validated their roadmap, and allowed us to collaborate on usability improvements.
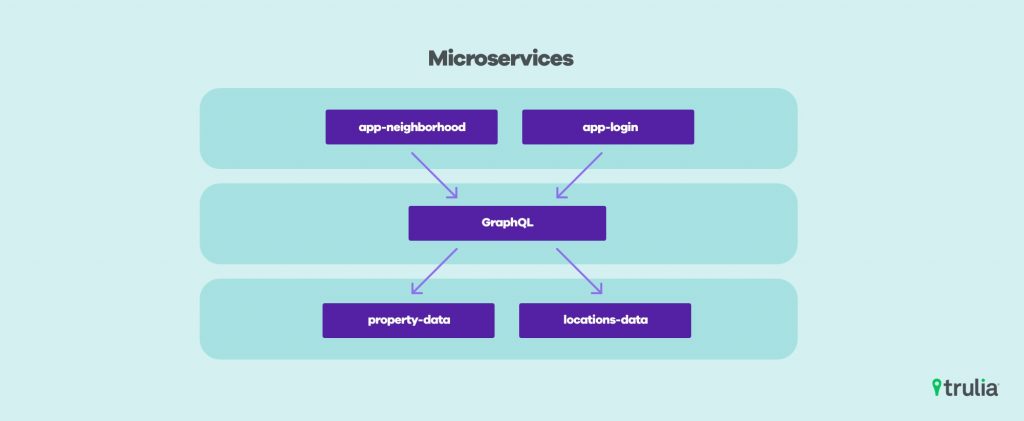
We did not want our users to have any knowledge of Istio in services at all and to interact only with the native Kubernetes Service discovery mechanism to find other services. Istio supports transparent proxying so a microservice uses only the native service discovery mechanisms of Kubernetes. Using a single technology for instrumentation also gives us a standard set of metric names and units to use and reason about traffic within the cluster.
Example metrics provided by Envoy:
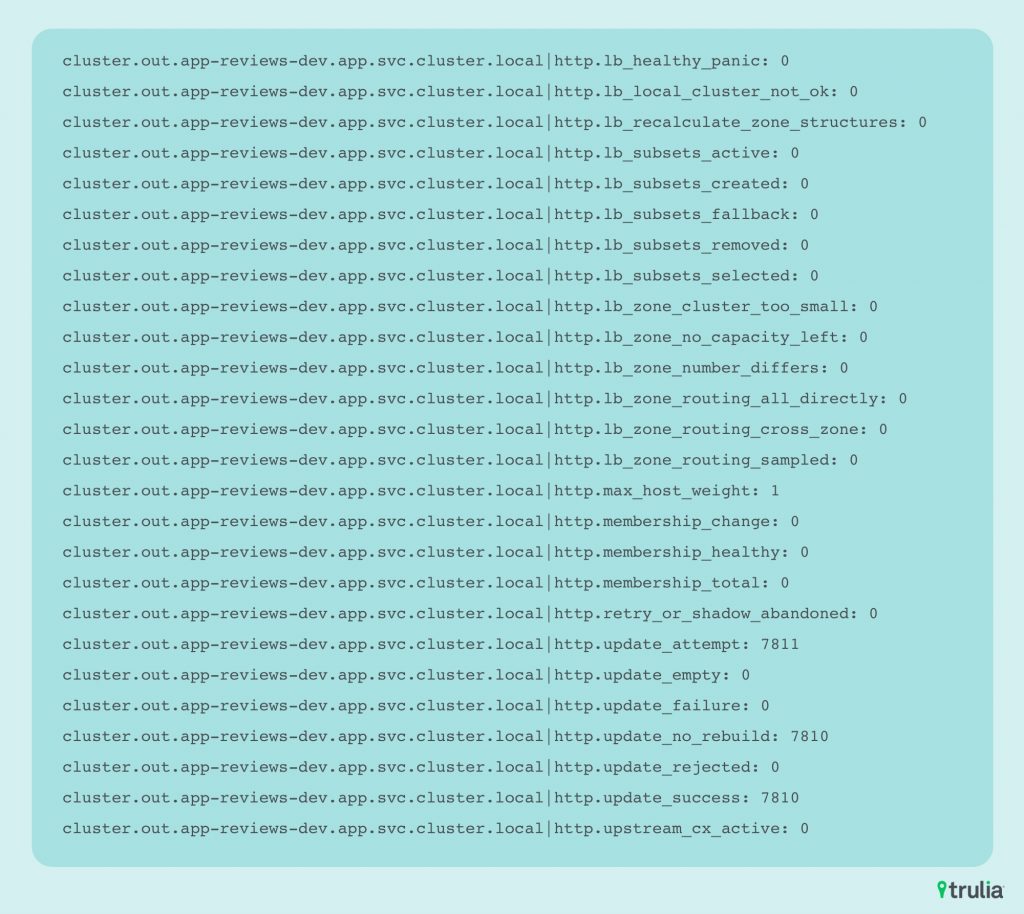
The metrics above are collected in Prometheus and used for alerting and graphing with Grafana. This Envoy is injected into every workload and is mined for information about request rates, latency and response codes.
Outcome
The usefulness of Istio’s observability became apparent as Trulia Neighborhoods was nearing launch. Developers on the neighborhoods team, working with a performance engineer, were able to identify multiple issues causing very high latency in key performance metrics.
Multiple slow legacy services resident outside of the Kubernetes cluster were found using Jaeger. Bringing performance in line with our SLA for the feature was as easy as contacting the service owners identified in the traces and scaling or optimizing for the new API calls. Operations engineers were not needed to remediate this, which before would have required the efforts of multiple teams and multiple systems.
With help from Kubernetes and Istio, Trulia is able to slay the PHP monolith, replacing it with a sustainable microservice architecture. Teams are no longer forced to manually add instrumentation to individual codebases or the infrastructure automation. Our engineers are empowered to deploy new microservices with out of the box observability and a single source of metrics. We’re thrilled with the freedom our new architecture provides, and the opportunity to learn, improve, and create.
Stay tuned for future posts that dive into related topics like microservices strategy, observability, and testing!