The hot markets that drove U.S. housing in recent years (we’re looking at you, coastal tech hubs) will give way in 2019 to a new group of affordable, young, opportunity-filled, desirable – and largely inland – cities primed to drive growth in the years to come.
Of the 100 largest U.S. metropolitan areas, Trulia identified 10 that we think are poised for takeoff, based on the following five key metrics:
- Job growth over the past year, as a measure of a robust economy.
- Vacancy rates, as an indicator that housing supply does not exceed demand.
- Good starter-home affordability, as a signal that first-time home buyers stand a chance at buying a home.
- More inbound than outbound home searches on Trulia, as a gauge that more people are interested in that market than those looking to leave.
- A large share of the adult population under the age of 35, which represents more potential first-time buyers.
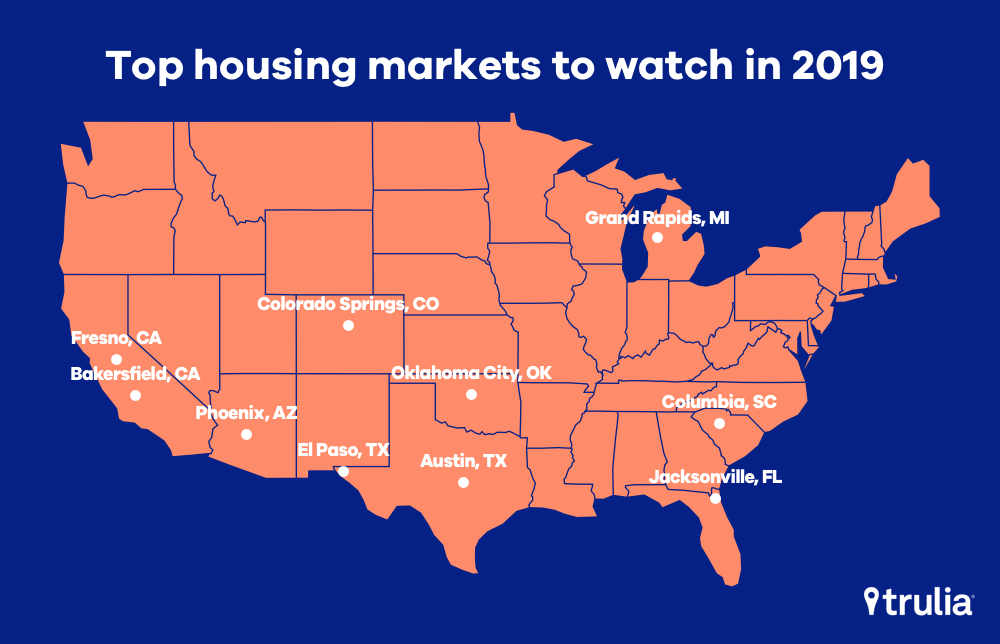
These are the markets to watch. So long Silicon Valley, and hello Heartland:
| Trulia’s Top 10 Housing Markets to Watch in 2019 | |||||||
| # | U.S. Metro | Y-o-Y Job Growth (Rank) | Vacancy Rate (Rank) | Share of Income Needed to Afford Median Priced Starter Home (Rank) |
Ratio of Inbound-to-Outbound Home Searches on Trulia (Rank) | Share of Population Under 35 (Rank) | Overall Score |
| 1 | Colorado Springs, Colo. | 3.3% (8) | 4.8% (35) | 35.4% (63) | 1.8 (17) | 23.6% (8) | 26.2 |
| 2 | Grand Rapids, Mich. | 2.0% (22) | 3.7% (16) | 23.2% (34) | 1.1 (41) | 21.7% (30) | 28.6 |
| 3 | Jacksonville, Fla. | 2.0% (24) | 4.2% (26) | 23.4% (35) | 2.4 (7) | 20.7% (52) | 28.8 |
| 4 | Bakersfield, Calif. | 0.6% (56) | 6.4% (68) | 14.3% (6) | 2.3 (8) | 23.1% (12) | 30.0 |
| 5 | Austin, Texas | 2.5% (14) | 3.4% (12) | 45.0% (79) | 1.1 (47) | 24.4% (4) | 31.2 |
| 6 | Fresno, Calif. | 1.6% (32) | 3.5% (13) | 47.1% (81) | 1.6 (22) | 22.6% (16) | 32.8 |
| 7 | Phoenix, Ariz. | 2.9% (9) | 4.0% (20) | 33.7% (59) | 1.3 (32) | 20.9% (47) | 33.4 |
| 8 | Columbia, S.C. | 0.4% (69) | 6.1% (63) | 13.7% (5) | 2.1 (12) | 22.3% (20) | 33.8 |
| 9 | El Paso, Texas | 1.0% (51) | 5.5% (48) | 33.5% (58) | 2.4 (6) | 23.2% (11) | 34.8 |
| 10 | Oklahoma City, Okla. | 2.0% (20) | 6.9% (76) | 21.1% (27) | 1.3 (33) | 22.3% (21) | 35.4 |
| Note: Rankings from among the 100 largest metros. | |||||||
Strong employment growth and a large share of young residents helped put Colorado Springs, Colo. at the top of the list of markets to watch (the area ranked in the top 10 of the largest 100 metros for both metrics). After topping last year’s list, Grand Rapids, Mich., came in second this year, with employment growth and low vacancy rates contributing to its strong performance. Jacksonville, Fla., is third due in large part to its strong inbound-to-outbound search ratio. Two Central California markets – Bakersfield and Fresno, the lowest-priced California housing markets among the largest 100 metros – also made the list this year.
Keen-eyed readers will notice a few things in common amongst the 2019 stars on this list. It does include a couple well-known growth areas including Phoenix, Ariz., and Austin, Texas. But it also highlights markets relatively close to more-expensive metros, but far enough away to offer their own attractions and opportunities without many of the mounting affordability concerns that mark those marquee names. Think Colorado Springs instead of Denver, and Bakersfield and Fresno instead of Los Angeles and the Bay Area.
We also identified the hottest neighborhoods in these markets, based on both local price appreciation and how quickly homes are flying off the market.
| Hottest Neighborhoods By Metro | |||||
| # | Housing Markets to Watch | Hottest Neighborhood | Y-o-Y Change in Home Values (Rank) | Median Days on Market (Rank) | Y-o-Y Change in Days on Market (Rank) |
| 1 | Colorado Springs, Colo. | Southeast Colorado Springs | 12.6% (1) | 42.2 (1) | -12.0 (6) |
| 2 | Grand Rapids, Mich. | Alger Heights | 16.2% (3) | 46.5 (4) | -8.5 (4) |
| 3 | Jacksonville, Fla. | Normandy Estate | 13.2% (8) | 56.8 (10) | -21.5 (19) |
| 4 | Bakersfield, Calif. | Northeast Bakersfield | 7.2% (4) | 56.5 (4) | -30.0 (3) |
| 5 | Austin, Texas | Southeast | 16.0% (4) | 43.0 (5) | -5.0 (24) |
| 6 | Fresno, Calif. | Mclane | 9.8% (3) | 52.8 (2) | -12.8 (1) |
| 7 | Phoenix, Ariz. | Agritopia | 14.6% (1) | 48 (34) | -18.0 (23) |
| 8 | Columbia, S.C. | South Kilbourne | 14.5% (2) | 69.5 (3) | -59.3 (1) |
| 9 | El Paso, Texas | Album Park | 7.9% (2) | 82 (3) | 1.0 (15) |
| 10 | Oklahoma City, Okla. | The Village | 5.7% (5) | 46.5 (1) | -19.3 (3) |
| Note: Rankings for housing markets to watch from among the 100 largest metros. | |||||
While there will certainly be local bright spots like the ones we’ve identified, in general we expect 2019 to be a year of moderation and continued transition in the U.S. housing market. After several years of breakneck appreciation following the end of the housing recession, the latter half of 2018 may have marked a turning point and the beginning of a return to more normalcy and balance in the market. Next year will continue to bring more sanity to the market for home buyers frustrated by years of stiff competition and chronically low inventory. But affordability concerns will still plague the market, especially as mortgage rates rise, putting buyers in a wait-and-see mode. Sellers will also respond to changes, potentially thinking twice before listing in an environment that may not be as lucrative as it was in recent years and further slowing buying and selling activity.
For more on Trulia’s outlook on housing next year, check out our predictions for 2019 here.
Methodology
To calculate the markets-to-watch metrics, we used a number of data sources:
- Employment growth is measured as the percentage increase in employment between September 2017 and September 2018, according to the Bureau of Labor Statistics’ Local Area Unemployment Statistics program.
- Residential vacancy rates (October 2018) are reported by the U.S. Postal Service’s Delivery Statistics and retrieved through Moody’s Data Buffet.
- Starter home affordability is determined using the median listing price of starter homes on Trulia in the third quarter of 2018. Household incomes are derived from 2016 American Community Survey microdata, adjusted to the current period using the Employment Cost Index.
- The ratio of inbound-to-outbound searches on Trulia is calculated using site traffic from October 2017 to the present.
- The share of population under 35 comes from U.S. Census Bureau estimates as of July 2017, released in June 2018.
The final score is tabulated by averaging the rank of these five metrics.
The “hot hoods index” is calculated by ranking neighborhoods within metros by:
- Year-over-year change in home values (faster price appreciation indicates a hotter market)
- Median days on market (fewer days on market indicates a hotter market)
- The change in days on market since last year (where bigger drops in days on market indicate a hotter market).
A neighborhood’s “hotness” is based on the sum of these ranks. Neighborhood-level days on market metrics are calculated using data for the 12 months ending September 2018. Neighborhood-level home values are based on the month of September 2018.

