Women and minorities who identify as the head of their household still aren’t borrowing to buy homes at the same rate of men and whites[1], respectively, even when they make the same income. As a result, they’re not only less likely to be homeowners, but are also locked out of one of the biggest tax benefits available annually.
That benefit, of course, is the mortgage interest tax deduction (MITD). In 2013 alone, taxpayers saved – and the U.S. Treasury lost — $80 billion as a result of the deduction.
The MITD is known to benefit higher income taxpayers – who are more likely able to buy homes and itemize their deductions. Only 12% of tax filers with less than $50,000 adjusted gross income (AGI) actually do, compared with 94% with $200,000 or more AGI, according to the Internal Revenue Service. And among all tax filers, nearly half – 49% — of the value of their itemized deductions is housing-related, which includes home mortgage interest, real estate taxes and a few other small deductions like deductible mortgage points and qualified mortgage insurance premiums.
So as a tax break for mostly higher income households, white heads of households are more than 3 times as likely to be eligible to claim the deduction than black heads of households and women are 31% less likely than men to be eligible to claim it.
One possible explanation for the disparity in mortgage borrowing and, in turn, homeownership is age and income. Most minority groups and women have lower incomes on average than whites and men, respectively, and are therefore less likely to take out a mortgage to buy a home – let alone take advantage of MITD. But is the MITD just a tax policy that benefits the wealthy? If we strip away those factors, are women and minorities still less likely to have mortgages than their white male counterparts?
To find out, we examined a big slice of U.S. households using the Census’ 2014 American Community Survey, accounted for age and income effects and looked at who had borrowed to buy a home. In other words we created an even playing field where race, ethnicity and gender were the only criteria separating the potential mortgage holder. So by age, income and geography our study group was the same. Nationally, we found:
- After controlling for age and income, blacks are still 56.9% less likely to own a home with a mortgage than whites. Blacks generally compared more favorably in Florida, California, and Texas and less so in Northeast and Midwest.
- With exceptions, the chances of a minority having a mortgage tend to be higher in cities where heads of households of that minority group make up a large share of the overall population. For instance, in Honolulu – where Japanese Americans make up 20% of all households – they are twice as likely to own as white households.
- In the San Francisco Bay Area cities, Chinese Americans are twice as likely to have a mortgage as whites, but 38.9% less likely to have a mortgage nationally.
- Hispanics are 50.9% less likely than whites to have a mortgage, but are more likely to own with a mortgage at the same rate or better in the Southwest and West. Hispanics in El Paso are more than twice as likely to have a mortgage as whites and make up more than 75% of all households.
- Single women are 6.2% less likely to own a home with a mortgage than single men, but had mortgages at a greater rate than men in San Antonio, Raleigh, N.C., Seattle, Denver and Tacoma, Wash., to name a few.
On the national level, controlling for age and income does not seem to account for much of the overall difference in the chances of having a home with a mortgage between racial and ethnic groups and whites. Why is this? For minorities, one reason why the gap is so large is the lack of intergenerational wealth transfers. Minorities have less access to financial assistance on down payments from relatives and are more likely to be in financial trouble when unexpected expenses arise. However, intergenerational wealth transfers were not factored into this analysis as they are difficult to measure.

As far as the gender gap goes, much of it is explained by age and income. Women do much better compared with men after controlling for age and income, but still fall short by 10.5%. This is likely because woman who identify as a head of household on Census forms are much more likely to be single than married. Meanwhile, men identify as head of households much more often than women in married households, and married households are significantly more likely own a home with a mortgage than single households.
So given the quirky ways in which married couples respond to census forms, we looked at just single, never-married women and men instead. When you control for age and income with this group, women are 6.2% less likely to get a mortgage than men. The gap is completely eliminated when we control for the number of children the head of household is raising. This is because 11.7 % of single men report having children while 37.2% of single women say the same. Many of these singles are likely shouldering a disproportionate share of the financial costs of raising children and this puts homeownership out of reach for many of them.
| Mortgage Holders Among Racial, Ethnic and Gender Groups | |||
| Racial or Ethnic Group | % That Owns Home with Mortgage | % More or Less Likely Than Whites to Own Home with Mortgage | |
| Not controlling for age and household income | Controlling for age and household income | ||
| White | 62.6% | * | * |
| Hispanics | 36.7% | -65.3% | -50.9% |
| Black | 35.0% | -67.7% | -56.9% |
| American Indian | 41.9% | -56.8% | -41.4% |
| Chinese | 53.2% | -32.0% | -38.8% |
| Japanese | 52.9% | -32.7% | -57.8% |
| Other Asian | 49.1% | -42.3% | -55.3% |
| Other Races | 39.7% | -60.6% | -52.9% |
| Two or More races | 42.2% | -56.3% | -43.2% |
| Hispanics / Non-Whites Combined | 38.4% | -62.7% | -51.7% |
| Gender | % of Never-Married Singles That Own Home with a Mortgage | % More or Less Likely Than Never-Married Single Men to Own Home with Mortgage | |
| Not Controlling for Age and Household income | Controlling for Age and Household Income | ||
| Men | 29.5% | * | * |
| Women | 25.2% | -19.6% | -6.2% |
This suggests that the narrative of the MITD simply being a policy that primarily benefits the wealthy is only part of the story. If differences in which groups can take advantage of the MITD can’t be explained by age and income, then in addition to fueling wealth disparities between rich and poor, the policy is also increasing wealth disparities between racial and ethnic groups among heads of households who are otherwise similar. Nationally, if you are a head of a household and you are any race or ethnicity other than white, you are between 38.8% and 57.8% less likely to be able to take advantage of the MITD than a white head of household of the same age and income.
Blacks Still 56.9% Less Likely to Own a Home with a Mortgage than Whites
Looking at the metro-level, blacks in Madison, Wis., are 90.5% less likely to own a home than a whites of the same age and income. This means that if the two population groups were the same size, for every one black head of household, there would be 10 white heads of households of the same income and age claiming MITD. On the other end, black people in Miami, Fla., are 14.6% less likely than white people to own a home; the smallest statistically significant difference between blacks and whites in the comparison.
Of the top 100 metros, there is not one where blacks are more likely to own a home with a mortgage than a white person even after controlling for age and income, based on this sample. The only metro where we cannot say with confidence* that a black person is less likely than a white person to own is in Albuquerque, NM, though this is primarily because blacks made up only 2% of the sampled households in Albuquerque.
| Black Mortgage Holders vs. Non-Hispanic Whites | ||
| U.S. Metro Area | % of Heads of Households That Are Black | % More or Less Likely Than Whites to Own Home w/ Mortgage |
| Albuquerque, NM | 2.1% | N/A* |
| Miami, FL | 14.6% | -14.6% |
| Cape Coral–Fort Myers, FL | 5.9% | -24.3% |
| San Francisco, CA | 5.0% | -24.3% |
| Washington, DC | 33.5% | -31.2% |
| Daytona Beach, FL | 8.9% | -32.1% |
| Los Angeles, CA | 9.3% | -32.2% |
| Fort Lauderdale, FL | 23.3% | -32.8% |
| Sarasota, FL | 5.1% | -38.9% |
| Austin, TX | 7.0% | -39.4% |
| National | 11.9% | -56.9% |
| Allentown, PA | 3.5% | -75.7% |
| Syracuse, NY | 6.4% | -75.7% |
| Gary, IN | 17.9% | -76.3% |
| Albany, NY | 5.9% | -76.4% |
| Lake County–Kenosha County, IL-WI | 6.6% | -76.5% |
| Grand Rapids, MI | 5.7% | -77.0% |
| Salt Lake City, UT | 1.2% | -77.6% |
| Warren, MI | 10.1% | -80.1% |
| Minneapolis–St. Paul, MN | 7.0% | -80.5% |
| Madison, WI | 2.9% | -90.5% |
| * Indicates results were not statistically significant at the 0.10 level.Note: Top 10 and Bottom 10 among 100 largest U.S. metros. To download the full data set for the 100 largest U.S. metros, click here. | ||
In SF Bay Area, Chinese Americans Twice as Likely to have a Mortgage as Whites
Nationally, Chinese Americans are 38.8% less likely to own a home with a mortgage than whites of the same age and income. From metro to metro, this figure varies considerably. Of the metros with some of the larger Chinese populations, where the difference is statistically significant, they are anywhere from 3 to 5 as likely to qualify for the MITD as whites (Las Vegas and Cape Coral-Fort Myers, Fla.,), to 95.3% less likely (Syracuse, N.Y.). In the two cities with the largest Chinese population, New York and Los Angeles, they are 4.8% less likely and 89.8% more likely to own, respectively. Chinese mortgage holder rates in San Francisco Bay Area cities are on par with Los Angeles.
| Chinese Americans Mortgage Holders vs. Non-Hispanic Whites | ||
| U.S. Metro Area | % of Heads of Households that are Chinese | % More or Less Likely to Own w/ a Mortgage |
| Cape Coral–Fort Myers, FL | 0.3% | 409.5% |
| Greenville, SC | 0.2% | 367.1% |
| Jacksonville, FL | 0.3% | 292.8% |
| Bakersfield, CA | 0.4% | 257.5% |
| Tacoma, WA | 0.3% | 235.9% |
| Las Vegas, NV | 1.5% | 199.9% |
| Miami, FL | 0.5% | 174.3% |
| Honolulu, HI | 6.8% | 170.8% |
| Riverside–San Bernardino, CA | 1.3% | 153.0% |
| Long Island, NY | 1.3% | 133.6% |
| National | 1.1% | -38.8% |
| Hartford, CT | 0.7% | -63.8% |
| Knoxville, TN | 0.2% | -66.8% |
| New Haven, CT | 1.0% | -70.5% |
| Dayton, OH | 0.3% | -72.1% |
| Grand Rapids, MI | 0.2% | -77.8% |
| Gary, IN | 0.3% | -87.5% |
| Wichita, KS | 0.2% | -90.0% |
| Toledo, OH | 0.6% | -92.8% |
| Baton Rouge, LA | 0.2% | -94.8% |
| Syracuse, NY | 0.5% | -95.3% |
| Note: Top 10 and bottom 10 among 100 largest U.S. metros. To download the full data set for the 100 largest U.S. metros, click here. | ||
Hispanics More Likely to Own with a Mortgage in the Southwest and West
There are seven metros in the analysis where Hispanics are more likely to own a home than whites. These places include, El Paso, Texas, Albuquerque, N.M., San Francisco, and Tucson, Ariz. In El Paso for example, a Hispanic person is more than twice as likely as a white person to own a home and have a mortgage, and therefore claim the MITD. In Birmingham, Ala., and Boston on the other hand, Hispanics are 71.3% less likely to own than whites.
| Hispanic Mortgage Holders vs. Non-Hispanic Whites | ||
| U.S. Metro Area | % of Heads of Households that are Hispanic | % More or Less Likely to Own w/ a Mortgage |
| El Paso, TX | 76.3% | 125.8% |
| Albuquerque, NM | 39.8% | 30.6% |
| San Francisco, CA | 22.9% | 29.4% |
| Honolulu, HI | 6.5% | 17.0% |
| Tucson, AZ | 26.3% | 9.4% |
| Miami, FL | 64.3% | 8.1% |
| Los Angeles, CA | 36.4% | 3.9% |
| Daytona Beach, FL | 40.6% | N/A* |
| Dallas, TX | 8.5% | N/A* |
| San Antonio, TX | 18.5% | N/A* |
| National | 12.1% | -50.9% |
| Cambridge, MA | 7.6% | -66.2% |
| Hartford, CT | 10.0% | -66.7% |
| Worcester, MA | 9.8% | -66.9% |
| Fairfield County, CT | 13.2% | -66.9% |
| Buffalo, NY | 3.6% | -67.5% |
| Newark, NJ | 14.3% | -67.7% |
| Minneapolis–St. Paul, MN | 3.8% | -68.6% |
| Knoxville, TN | 2.6% | -70.4% |
| Boston, MA | 7.9% | -71.3% |
| Birmingham, AL | 2.8% | -71.3% |
| * Indicates results were not statistically significant at the 0.10 level. Note: Top 10 and bottom 10 among 100 largest U.S. metros. To download the full data set for the 100 largest U.S. metros, click here. | ||
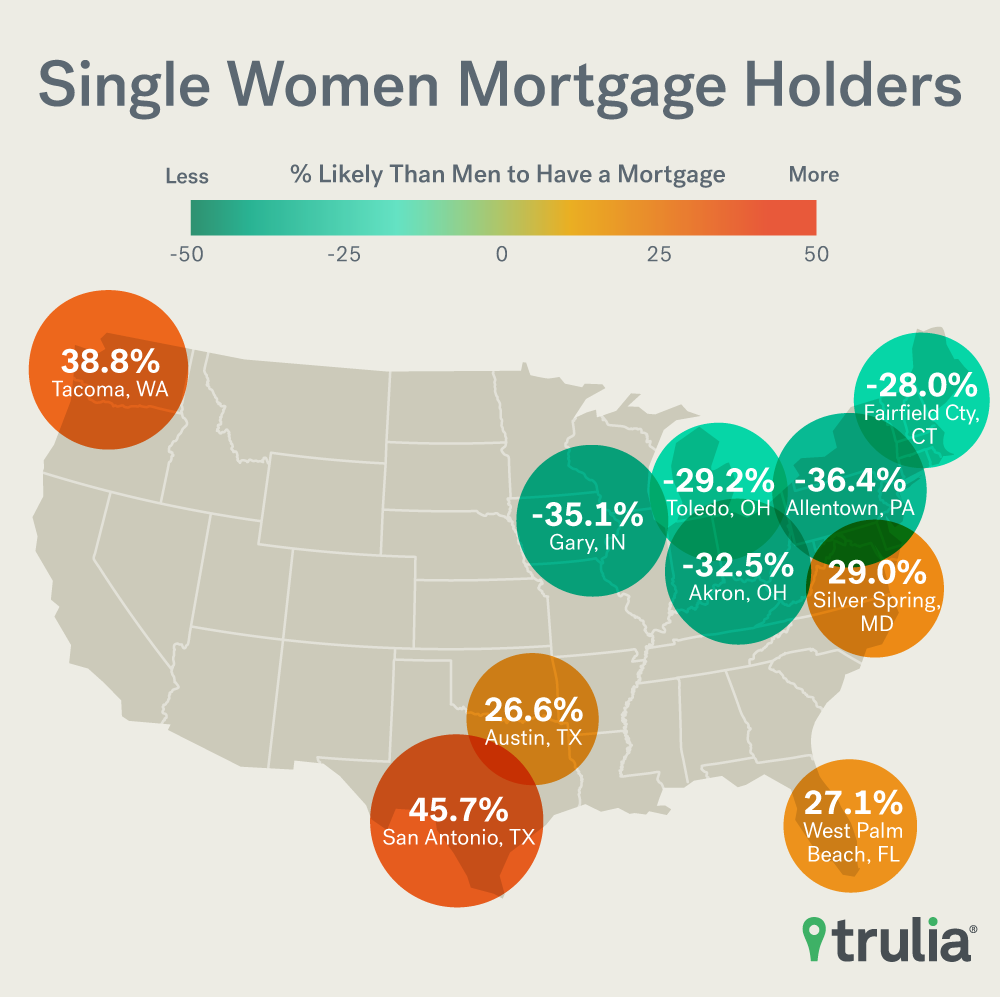
Single Women Are 6.2% Less Likely to Own a Home with a Mortgage
Among single, never married men and women in the top 100 metros, the homeownership rates between household heads of the two groups are not statistically different in 63 of them after controlling for age and income. Of the metros where there are measurable differences between the two groups, fifteen of them show that women are more likely than men to have a mortgage, including San Antonio (45.7%), Raleigh, N.C. (17.9%), Seattle (20.7%) and Denver (10.4%).
Meanwhile, in 22 of the 100 largest metros, men were much more likely to own then women. This includes Allentown, Pa., and Riverside-San Bernardino, Calif., where women are 36.4% and 23.5% less likely than men to own a home after controlling for age and income. These are largest gender difference in the 100-metro comparison.
| Women Mortgage Holders vs. Men | ||
| U.S. Metro Area | % of Single Heads of Households that are Women | % More or Less Likely to Own w/ a Mortgage |
| San Antonio, TX | 45.6% | 45.7% |
| Tacoma, WA | 51.7% | 38.8% |
| Silver Spring, MD | 57.9% | 29.0% |
| West Palm Beach, FL | 52.9% | 27.1% |
| Austin, TX | 49.0% | 26.6% |
| Birmingham, AL | 61.8% | 22.4% |
| Seattle, WA | 45.3% | 20.7% |
| Raleigh, NC | 54.7% | 17.9% |
| Tucson, AZ | 49.6% | 16.3% |
| Philadelphia, PA | 53.3% | 16.2% |
| National | 53.3% | -6.2% |
| Grand Rapids, MI | 52.4% | -22.7% |
| Riverside–San Bernardino, CA | 59.8% | -23.5% |
| New Haven, CT | 56.2% | -24.6% |
| Warren, MI | 51.5% | -26.5% |
| Richmond, VA | 54.5% | -27.4% |
| Fairfield County, CT | 54.7% | -28.0% |
| Toledo, OH | 55.8% | -29.2% |
| Akron, OH | 54.2% | -32.5% |
| Gary, IN | 55.2% | -35.1% |
| Allentown, PA-NJ | 52.3% | -36.4% |
| Note: Top 10 and bottom 10 among 100 largest U.S. metros. To download the full data set for the 100 largest U.S. metros, click here. | ||
The MITD not only offers a tax benefit to predominantly wealthier households, it also disproportionally provides a tax benefit to whites or men of the same age and income as their non-white or women peers. While the MITD is meant to incentivize home ownership, our findings suggest it may also be exacerbating racial, ethnic and gender wealth disparities.
So what are the policy implications? With minority groups still at a substantial disadvantage in the housing market, a more ideal tax policy would at least do no harm when it comes to existing wealth disparities. Two possible ways to do this are to (1) eliminate or to (2) change the mortgage interest tax deduction. There is no shortage of ideas on how best to do this. One possibility would be to turn the deduction into more of a housing tax credit that would go to mortgage holders AND renters regardless of whether or not they itemize. However, both of these options would face strong political opposition and are unlikely to happen in the near future.
[1] For the purposes of this report, we refer to the census designation of “non-Hispanic whites” as “whites.”
Methodology
To come up with the figures above, we used non group-quarter 5-year 2014 American Community Survey household-level microdata (IPUMS – Steven Ruggles, Katie Genadek, Ronald Goeken, Josiah Grover, and Matthew Sobek. Integrated Public Use Microdata Series: Version 6.0 [Machine-readable database]. Minneapolis: University of Minnesota, 2015.), as well as a PUMA to County equivalency file from the Missouri Census Data Center to weight household level responses appropriately based on geography and survey weight provided in the IPUMS data. After that, all households that were owned free-and-clear or that were in a cash-free rent arrangement were dropped from the sample, leaving only traditional renters and owners with a mortgage.
To compute how different groups’ ownership/mortgage status compared to that of non-Hispanic whites (or men for the gender comparison) before controlling for age and income, an indicator variable was created to identify whether or not the household was an owner household (with mortgage) or not, and odds ratios were calculated. To control for age and income, we used the following logistic regression models for each metro:
For the race comparison, all Hispanics were dropped from the sample and race was treated as a factor.
own_indicator = HHincome + HHincome^2 + age + age^2 + race
For the ethnicity comparison, only Hispanics and non-Hispanic whites were kept in the sample and an indicator was created based on whether or not the respondent was Hispanic or not
own_indicator = HHincome + HHincome^2 + age + age^2 + hisp_indicator
For the gender comparison, only household heads who identified as “Single, Never Married” were compared and just the gender factor was used in addition to age and income
own_indicator = HHincome + HHincome^2 + age + age^2 + gender
A 0.10 level of statistical significance was used for all coefficients.

